
What Is the Digital Shelf?
The digital shelf is every online location where shoppers discover and buy products: retailer websites, marketplaces, grocery delivery apps, and search results. It is the e-commerce equivalent of a physical store shelf. Where a product ranks, whether it is in stock, and how its page looks all decide whether a shopper adds it to the cart.
Winning the digital shelf means showing up first, in stock, correctly priced, and with accurate content. Losing it is usually invisible until sales drop, which is why measurement matters.
What Digital Shelf Analytics Measures
Digital shelf analytics turns scattered product pages into a scoreboard. Each metric answers a specific commercial question about visibility and competitiveness, and together they explain why a product wins or loses online.
The core digital shelf metrics:
- Availability, is the product in stock across each retailer and location?
- Share of search, how often does it appear, and how high, for category keywords?
- Pricing and promotions, how do price and discounts compare to competitors?
- Content compliance, are titles, images, bullets, and descriptions correct and complete?
- Ratings and reviews, what is the star average and review volume versus rivals?
- Placement / buy box, who owns the buy box or top placement on each page?
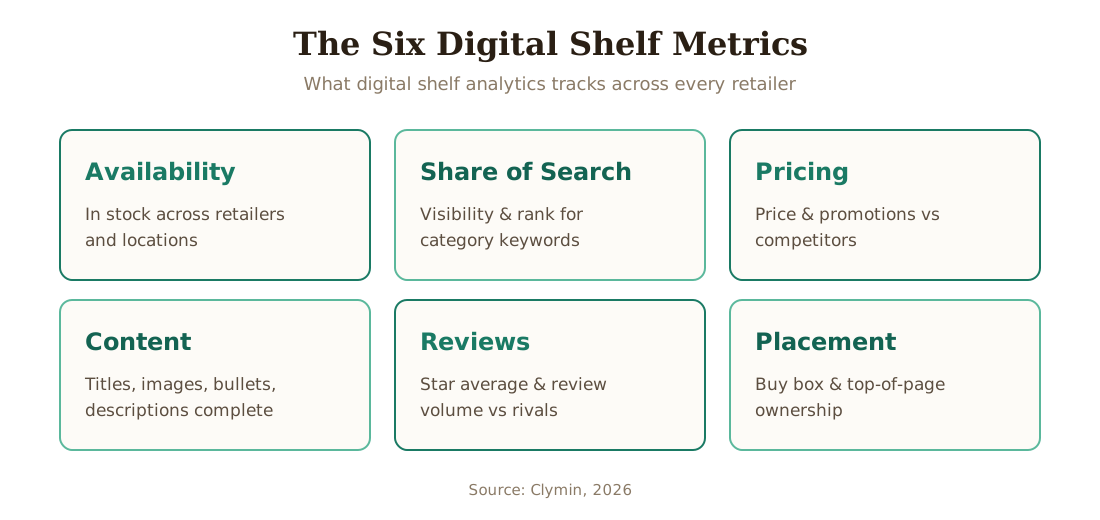 Digital shelf analytics combines six metric families into one view of how visible and competitive a product is online.
How Is Digital Shelf Data Collected?
Digital shelf data comes from extracting product pages and search results across many retailers at regular intervals. A single brand may need daily snapshots from dozens of retailer sites, each with its own layout, login walls, and anti-bot defenses. The collection problem, not the dashboard, is the hard part.
Reliability is where most in-house efforts stall. Sites change structure without warning, and protected pages return blocks instead of data, so the pipeline needs constant maintenance. For the broader category and why teams outsource it, see our guide on what managed web scraping is.
Who Uses Digital Shelf Analytics and Why
Consumer brands, retailers, and quick-commerce operators all rely on digital shelf analytics, each for a different reason. The common thread is that online visibility now drives revenue as directly as shelf placement once did in stores.
According to the U.S. Census Bureau, e-commerce made up roughly 16% of total U.S. retail sales by 2024, so where a product ranks online increasingly decides whether it sells.
According to Grand View Research's 2024 analysis, the web scraping software market that underpins this monitoring exceeded $1 billion in 2023 and is growing at a double-digit annual rate, reflecting how much brands now invest in online visibility data. Brand managers use the data to protect content and search rank; pricing and category teams use it to track competitors and promotions. For the pricing slice specifically, Clymin's price intelligence services feed the same datasets, and SKU-level tracking is covered in e-commerce SKU tracking and monitoring.
How Clymin Fits In
Clymin is a managed data extraction service operating from offices in San Francisco and Hyderabad, serving customers in the United States, India, and globally. Rather than selling a dashboard, Clymin delivers the clean, structured digital shelf data that dashboards and analysts depend on, refreshed at any frequency across hundreds of retail sources.
As of 2026, the limiting factor in digital shelf analytics is rarely the analysis; it is getting accurate, current data from sites that resist collection. Clymin handles that collection end to end, with 12+ years of experience on the hardest retail and app sources and 99.9% pipeline uptime.
Ready to Power Your Digital Shelf View?
If you need accurate, current product data across every retailer you sell on, Clymin will run a free pilot on your sources and deliver clean records before you pay anything. Email contact@clymin.com or start a free pilot, one metric, cost per record delivered, no setup fees.